


Today, visual impression is more important than ever, and the expectations of your audience for a perfect document or presentation are higher than ever. Also, data have gotten much more complex in the last 20 years, making it more difficult to transmit the meaning of your data with off-the-shelf graphs and tools. Be it your corporate presentation or document, a scientific document (journal publication, thesis, presentation for a talk), or interactive graphs for your website – we offer custom-made visualization of data and text. We use graph generation capabilities of R, D3, and JMP, image processing software like Adobe Photoshop, Illustrator and Inkscape, and layoutting systems like Adobe InDesign and Latex.
Impress your audience ! contact@lifedatascience.de
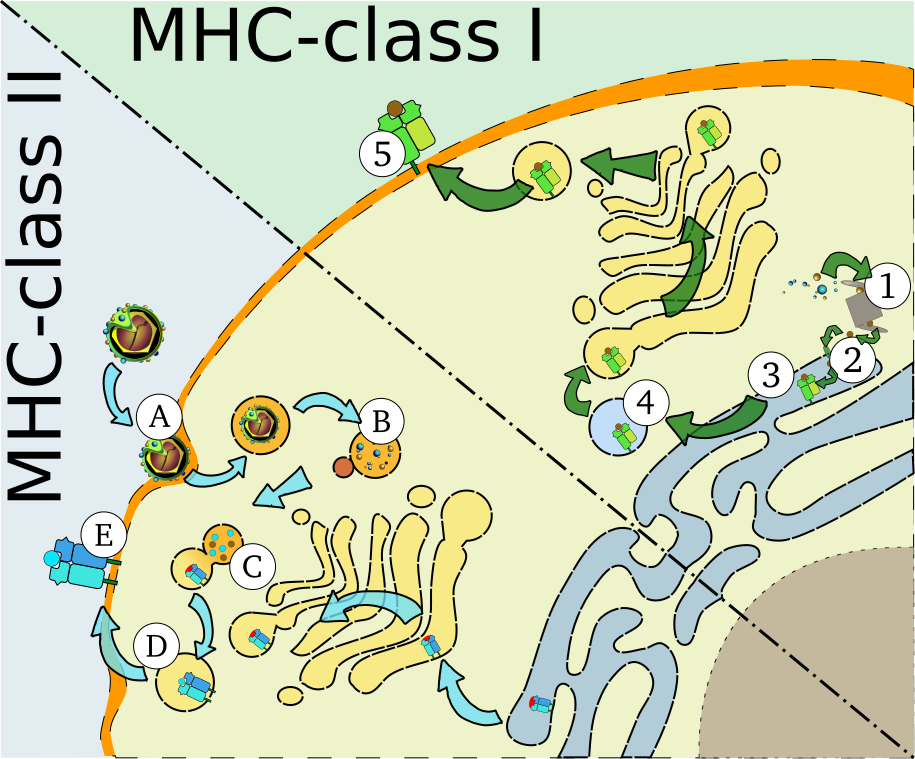
MHC-I pathway: 1. The proteasome cuts viral (and other) particles in shorter peptides; 2. Those peptides are transported inside the ER lumen via TAP; 3. In the ER further modifications are made and the peptide is then loaded onto the MHC-class I molecule; 4. This molecule plus peptide is then transported via Golgi apparatus to the cell surface; 5. The peptide is presented on the surface. MHC-II pathway: A. Viral particles are ingested by endosomal compartments; B. Inside those particles and with the aid of lysosomes, proteolytic degradation produces peptides out of the viral proteins; C. The phagolysosome fuse together with Golgi vesicle including inactivated MHC-class II molecules; D. The MHC-class II molecules binds a suitable peptide; E. The peptide is presented on the surface.
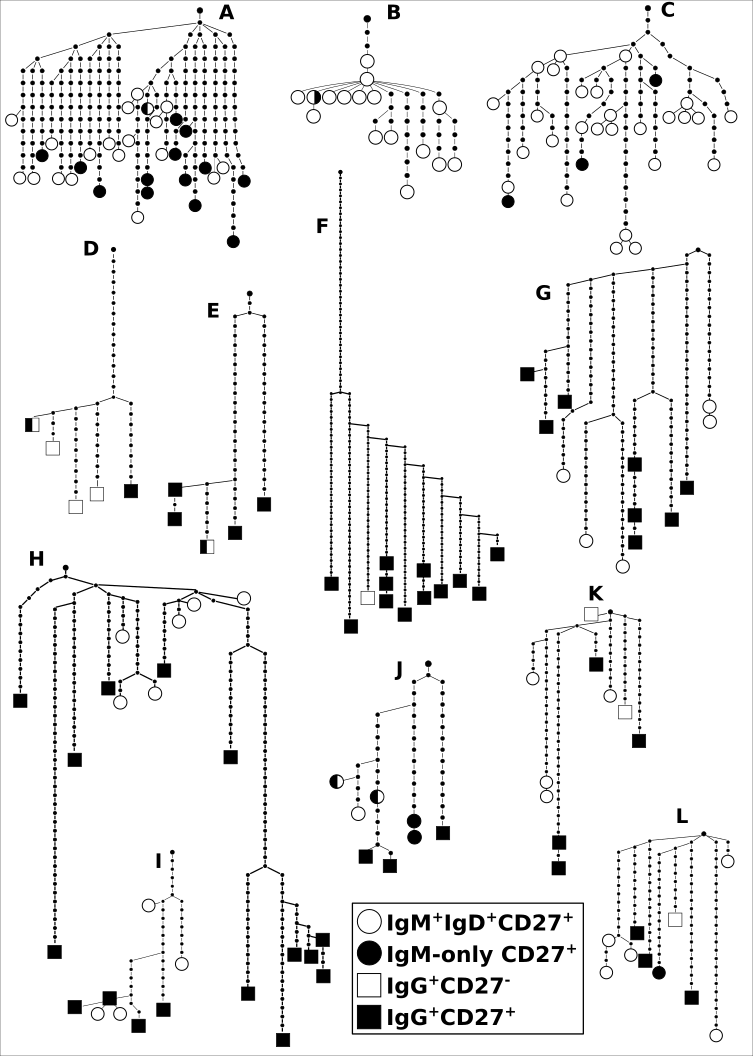
(A–C) Sole IgM clones usually show an early and broad diversification, leading to bushy dendrograms. (D–F) Sole IgG clones tend to have long roots and narrow shapes. (G–L) typical examples of composite clone dendrograms, where IgM and IgG memory B-cell subsets are intermingled. Specific subsets are indicated by a gray scale code (legend), germ-line IGHV (root), and sequential mutation events are marked as small black circles. Less than 1% of nodes or leaves represent more than one sequence; occasional contributions from independent subsets are given as circles with split shading.
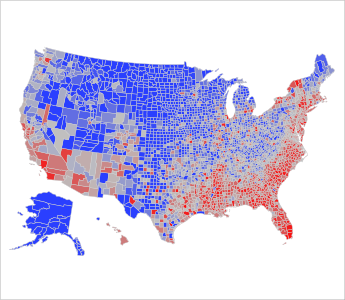
USA state coloring according to the HIV prevalence. Blue: low HIV prevalence; red: high HIV prevalence.